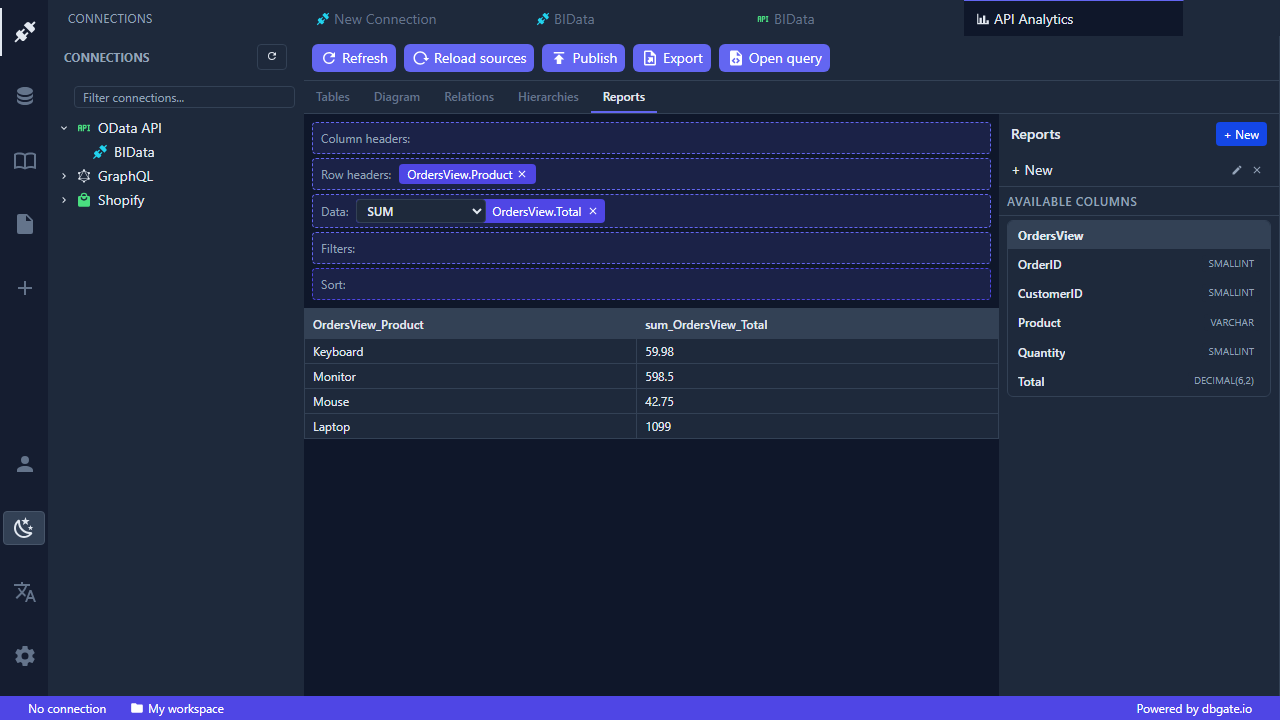
BI Reports from API Data
DbGate Central loads your API responses into its own built-in data engine, so you can combine, aggregate and visualize them - turning raw API responses into readable BI reports.
From raw responses to insight
- Aggregate and pivot your data into summary tables - counts, sums and breakdowns by any dimension.
- Relate multiple sources so a report can join data that lives behind different endpoints.
- Drill down through hierarchies to move from the big picture to individual rows.
oData and Shopify endpoints (and CSV/JSON/Excel files) can be used as BI sources. GraphQL APIs are great for querying, but are not currently available as a reporting source - browse and query them directly instead (see Querying GraphQL APIs).
Sharing a report
Reports can be published as a standalone, read-only view. Anyone with the link sees the live data and can drill down, without an account and without access to your connection.