Charts
With DbGate, you could use chart for visualization of your SQL queries. Simply execute query, in chart is auto-detected, the tab “Chart 1” will appear. If you have more query results, there could be more charts.
If no chart is autodetected, but you would like to create some chart from your query results, right click on your query result data and choose “Open chart”.
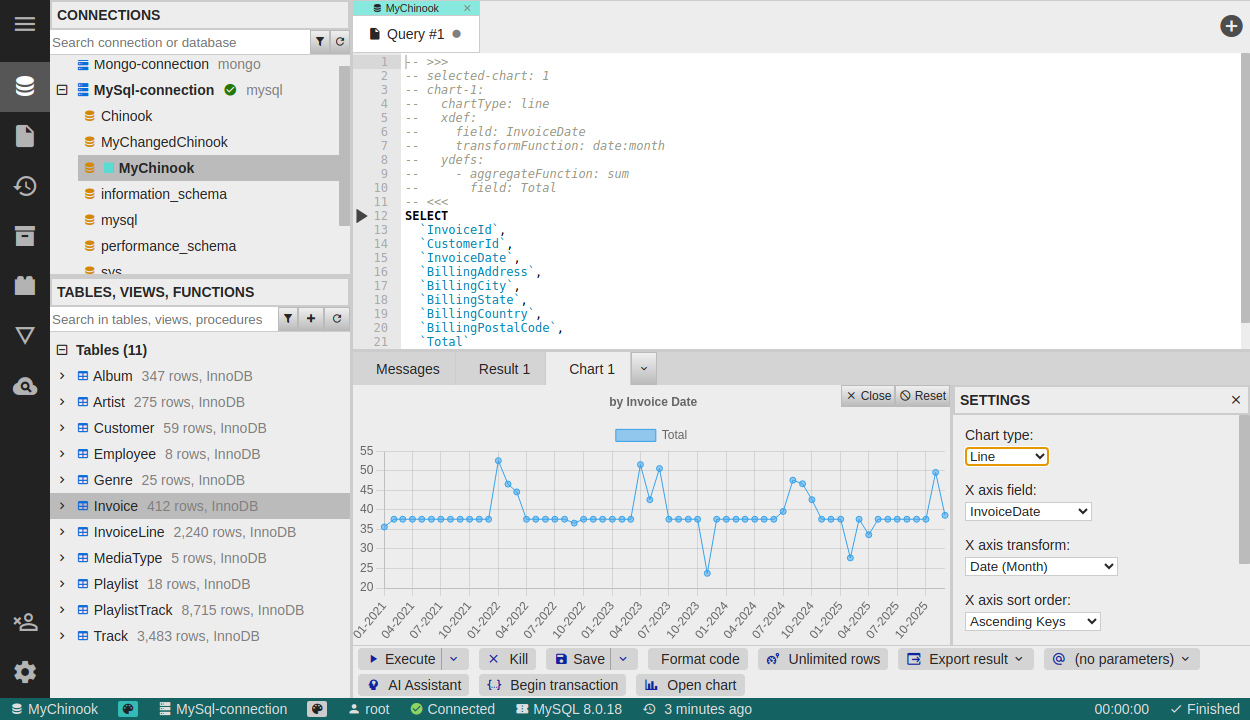
Chart settings
Use Customize button for invoking chart settings. You could configure chart data source and style:
- Chart type
- Bar
- Line
- Timeline - it’s special case of line chart, with time on X axis
- Pie
- Polar area
- X axis field - data on X axis. For date/time calues, grouping and timeline functions are available
- Grouping field - defines more charts specified by value of this field
- X axis transform - allows to define grouping for X - axis timeline (eg. by year or by month)
- Y axis field N - you could have more fields on Y axis
- There is special field available for each data set, “Count”, which counts rows
- Aggregate function - Sum, Minimum, Maximum, Average, First Value, Last Value
When you change any option in chart settings, it is saved at the beginning of the SQL script as front-matter.
Manually editing chart definition
Some options are not available in editor, but they could be edited in SQL code. Please read SQL front matter for more info